Using U.S. Census Data to Create Maps:
This week we worked with data directly from the 1990 and 2000 U.S. Census. I thought it was pretty insightful and realized that there are so many possibilities for the information that is collected in the census. My dad is a demographer, so since I was young I was surrounded by references to the census, whether U.S. Census post-it notes or some project my dad was working on. The census is an incredibly powerful tool that helps us understand the current state of things in the U.S., and even more importantly, when compared to other data, where we are going in the future.
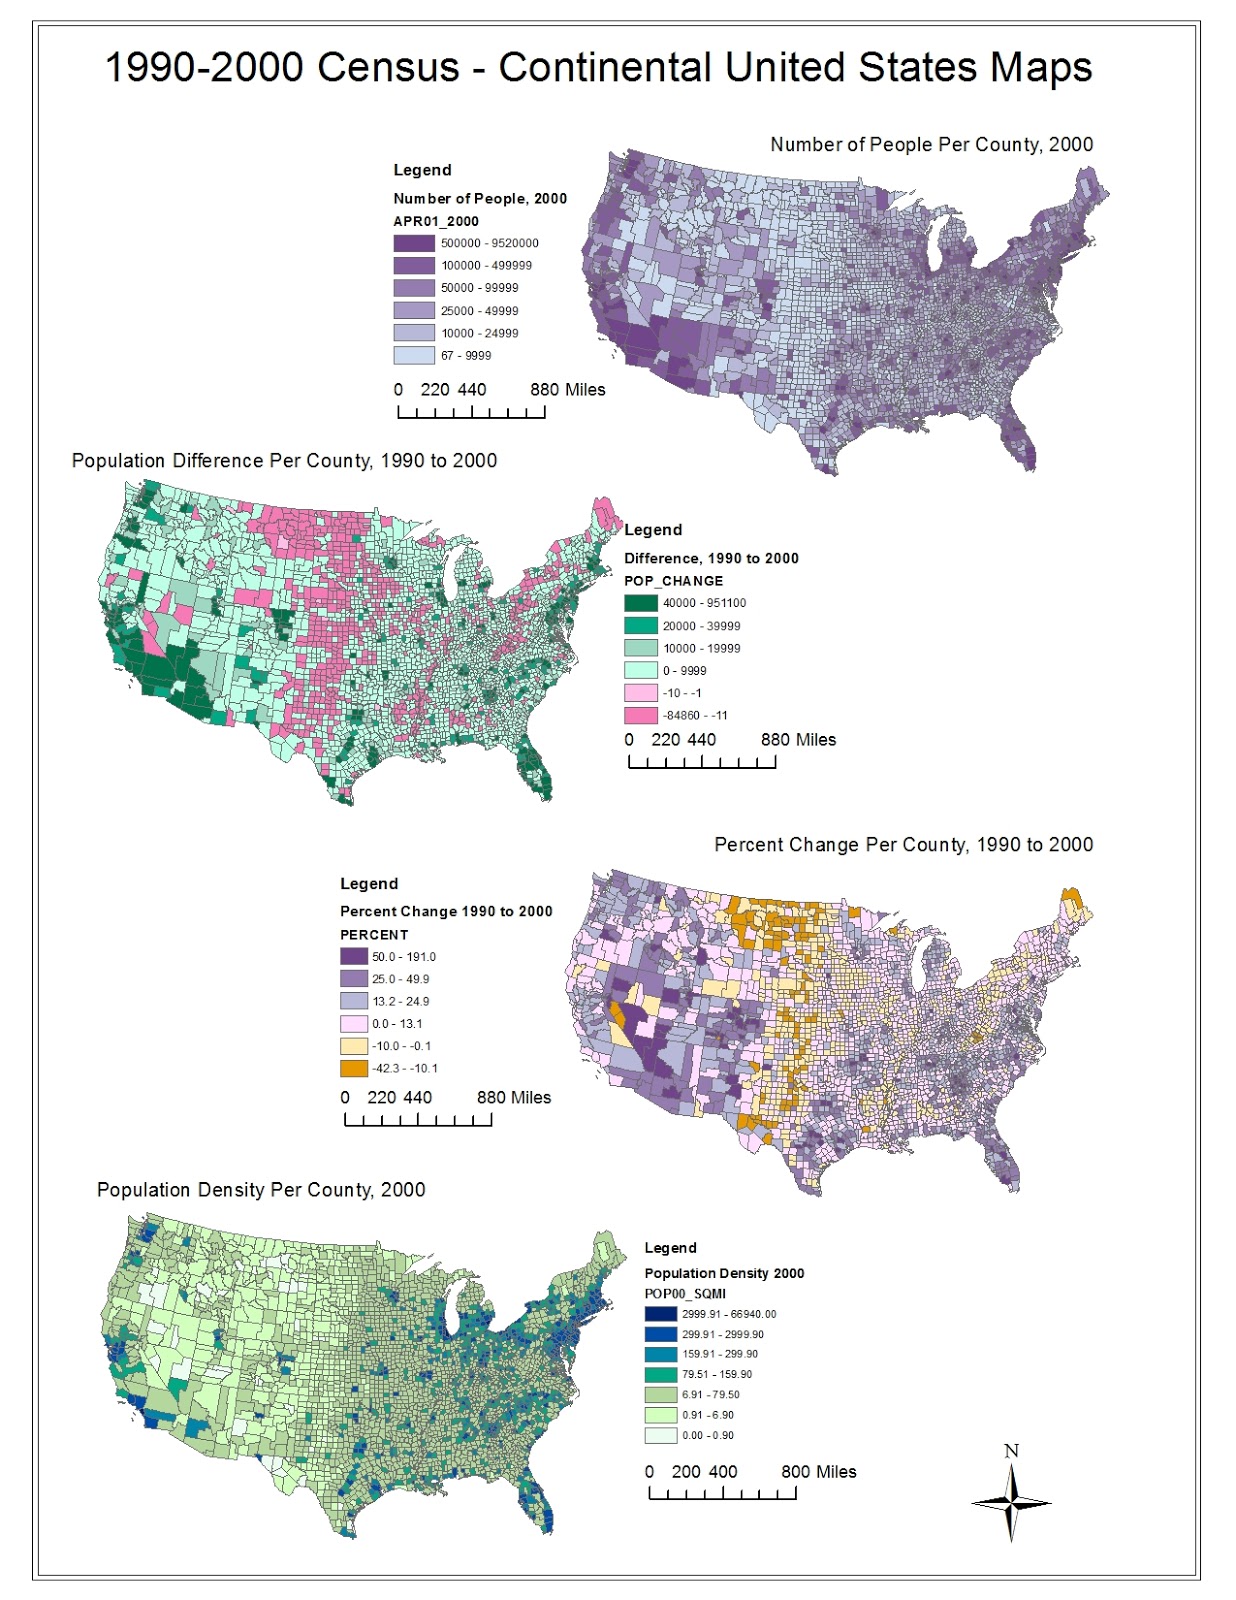
The first map shows the Number of People per County in 2000 and shows a clear trend of dense population on the coasts and increasingly less population towards the center of the country. It seems like some of the biggest concentrations are in Southern California, the Pacific Northwest (Seattle Area), the Southern tip of Florida, and the New England area. What is also an interesting trend for all four of the maps is that the county sizes on the East side of the country are much smaller than those on the West side. This means that if the population per county is comparable, the density in an East coast county would likely be greater (though not always true). If anything, this map helps illustrate how the American population has, over the years, spread itself from the East coast to every corner of the country.
The second map shows changes in county populations from 1990 to 2000, and again we see a significant difference between the middle of the country and the coasts. From 1990 to 2000, we see an incredible change in population as people move from Middle America out towards the surrounding areas, especially the coastal areas (Maine excluded). Although one can't necessarily tell from just this map, I think the movements are likely also related to urban vs. rural areas, as individuals are probably migrating towards urban areas. States like California and Florida are largely green, showing great population increases in those states over the ten year period.
The third map shows the percent change per county from 1990 to 2000. We see a similar story to the second map, but the narrative is different. I think that mapping the percent change per county perhaps focuses more on each individual county or groups of counties because we see that some of the counties in dark mustard yellow have decreased between 10 and 42.3 percent over the ten year period. Why is this? Can we find other census data that correlates with these massive decreases? Per capita income? Cost of living? These maps are truly captivating because they don't just show us what is happening, they also bring up a lot of questions and help us analyze the state of the union.
The fourth and final map illustrates the population density per county in 2000. It looks like some of the most consistently dense counties are on the Northeast coast and up near San Fransisco. This map paints a different picture than the first map of number of people per county. As an example, when I looked at the first map, I talked about huge populations in Southern California. While this may be true, counties like Los Angeles County are huge in area and as a result, are not that population dense. Comparing this map and the first map emphasizes the idea that we need to make sure we understand exactly what kind of map we are looking at because slightly different data can paint very different pictures of the continental United States.
This may have been my favorite lab so far because it showed us how to tap into the massive resource that is the U.S. census. I think that as a designer, I will be able to use census data for data visualization or research. The map exercise illustrated that we must carefully pick our data as well as our aesthetic language to show exactly what we want to show because there are countless variations. As viewers, we must also be careful to make sure we understand what exactly we are looking at. As I said before, the map exercise creates many questions, and I think these questions (Why are they moving towards the coasts? Why are these counties the densest? Why do we see population percentage dips in most counties in Maine?) are the essence of why cartographers, demographers, and other people throughout industries everywhere do what they do. How can we answer these questions and come up with meaningful and applicable solutions? The Census data combined with GIS is just a starting off point for much greater exploration of the dynamics of our country.
No comments:
Post a Comment